
Unless it’s about counting money on our bank account, then for many of us, numbers are hard to remember and boring. We need a context and a good reason to process them. Not to mention making something useful out of it. The same goes for FinTech users. What if you could help them through storytelling?

Bringing data to life with good storytelling is not only possible but necessary. People want to manage their personal finance – put money into an account, withdraw, borrow, sometimes even invest. Money flows and their dynamics are useful only to those who can make connections between how much they are making, how much they spend, and how to make more.
Benefits of storytelling with data
Communication always goes both ways. When implemented, FinTech storytelling can be useful for both: application users and its owners. Advantages cover:
- Easy memorizing and processing of financial information. Since raw data is linked to a meaning (often an emotional one) it’s easier to connect numbers to real-life, personal examples. Data has context, can be understood and shared with friends, other family members, etc.
- Increased trust for the company behind the application. When it comes to money, people tend to be critical and cautious. Choosing the right FinTech app can be difficult, there are a lot of them. Explaining what the app does and how users can work around concrete numbers, increases transparency, and builds a relationship. It’s important especially for the software-as-a-service (SaaS) business model.
- Long–term customer relationship. Storytelling with data builds an emotional connection with your brand. Customers identify the company behind the app and the app itself with positive emotions, practical use for the app. They perceive the product as an everyday necessity. Something they understand and value. The product becomes an experience.
- Lower costs of customer retention. Customers pay for products; loyal customers create communities around them. Good examples come from the InsurTech sector, where information serves as a lever for turning users into engaged product ambassadors.
- Increased market reach. If you have a product, you have to invest in marketing. If you have a story, you got the potential to naturally “infect” people with your messaging. Nobody cares about a product. People care about useful applications. Everybody cares about a good story. Real-life examples and marketing-tailored messaging can reduce user acquisition costs and increase market reach by word-of-mouth.
Story = words + images
You can either use words alone or support them with images and animations. The most successful thing would be to use both. Visualizing data through simple images, coupled with marketing microcopy, engages the user.
Removing clutter surrounding data should be done through adoption or creation of the right design system. That way you can use the correct user experience and user interface (UX/UI) design principles.
Bringing data to life with good storytelling
There is a phenomenon called “the last mile in analytics”. According to CrowdFlower, data scientists and marketers spend around 60% of their time cleaning and organizing information. 19% of their time is swallowed by collecting data sets. In total, a staggering 80% of their time is eaten by preparing and managing data for analysis. Mining data for patterns, which should be the most important part of the process, takes only 9% of the time.

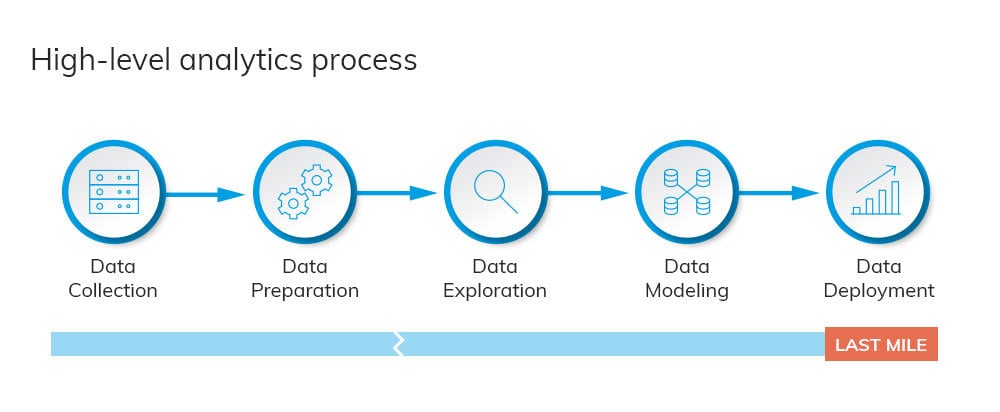
If it’s so complicated for professionals, don’t expect average users to be moved by numbers. The famous “last mile” is data deployment, which means delivering information + recommendations to the people that matter. In this case, to users. A big success of the FinTech industry comes from personalization and creating experiences. To display data properly and give the user some feedback, you need to prepare first.
5 steps for successful data usage
There are some steps you need to take on your journey in storytelling with data. They will help you establish the right strategy and prepare engaging stories.
- Create a customer segmentation based on customers’ profiles. Take into account factors like monthly income, spending, historical money flows (at least 3-6 months), etc.
- Identify main channels of users’ transactions (debit or credit cards, ATMs, online).
- Analyze data towards spending/investing habits and personalize the experience with new offerings and stories to go with them.
- Visualize personalized data for every single user. Draw from statistics, in-app behavior, and create visual content that helps people make accurate financial decisions. Fuel visuals with a copy for better results.
- Prepare plans for cross-selling and upselling. They should be based on previously created customer profiles and analyzed behavior.
Examples of storytelling with data
FinTech’s global success is largely based on something unspoken. It’s called “quantified self” (QS). It’s a term coined in 2007 by Gary Wolf and Kevin Kelly. It’s about gaining knowledge through self-tracking. Do I have a problem with spending too much money on clothes? Could I spend in a nearby shop two times a month instead of two times a week and gain discounts and bonuses? FinTech apps help with that.
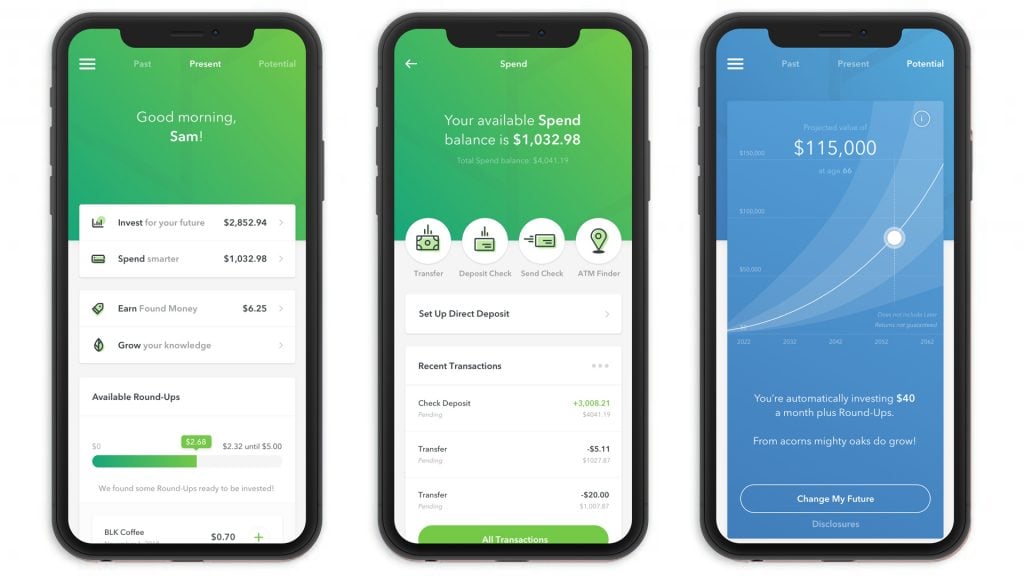
There are companies that put many thoughts into showing users the future value of their investments. Like Acorns, which puts data to work in a clever way. Instead of displaying chunks of data, it breaks it into smaller pieces and showing the user how they are doing. Progress on spending, progress on saving’ everything has its place.

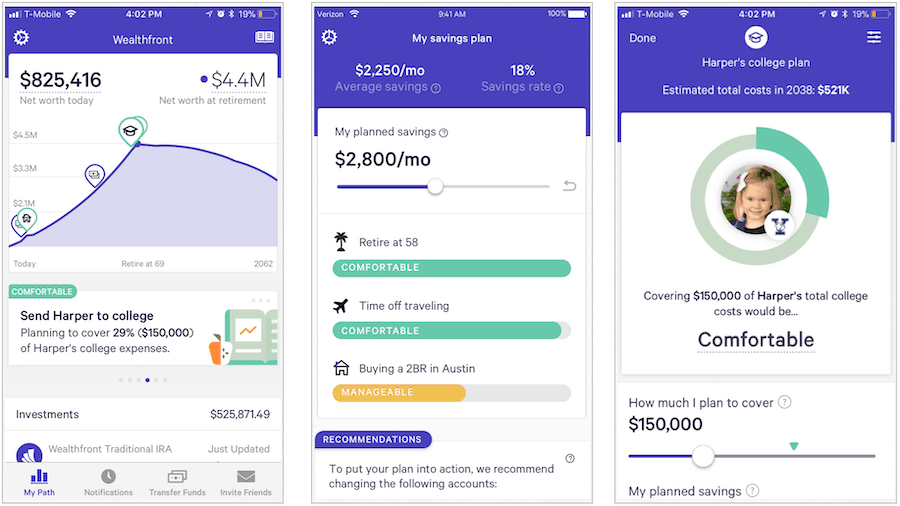
There’s also Wealthfront. It’s all-around digital banking, borrowing, and investing app. It covers major topics of personal finance, showing customers their habits and allowing them to modify their financial projections. By seeing goals on the horizon, users have a compelling reason to stick to the app and invest with it.

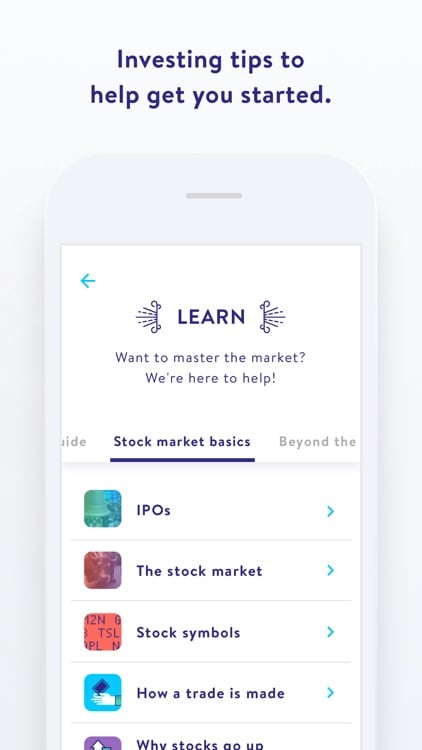
And what about Stockpile? It’s a brilliant example of how to talk about data by… removing it. At least at first. The app lets beginners invest in stocks. People find the stock market intimidating and confusing. Stockpile is removing all unnecessary pressure. The user chooses a sector (for example tech, fashion, gaming). Then the app displays a list of eligible companies. Next, the user gets information about share value, price, and trends (going up or down). And that’s it.
Where’s the story? In context. The app has a learning section, where people can learn absolute basics. What is the stock? What should I buy? Where to start? Even a growth calculator brings people on a journey. Users can invest with even 5 dollars, and there’s an option for creating a custodial account for minors.

Summary
The BFSI (banking, financial services, and insurance) industry can benefit from data as much as their customers. By putting an application’s user in the center of business processes, they can establish an end-goal in mind. In a short, excellent article by McKinsey experts are saying:
companies should start by identifying the decision-making processes they could improve to generate additional value in the context of the company’s business strategy and then work backward to determine what type of data insights are required to influence these decisions and how the company can supply them
A mouthful, so let’s simplify it a little bit. If you can identify a pain-point on a market and address that with your app, you can solve a problem for users. By supplying them with constant, simple, and easy-to-understand data on their personal finance, you can turn your brand into a household name, quite literally.